This is a high-scoring sample answer for the following Academic IELTS Writing Task 1 essay question: The chart below shows three different crimes and the number of cases committed between 1970 and 2005 in England and Wales. Collocations about crime can be found here. Below, also, is a list of less common vocabulary with definitions. Read the sample answer, then send me your essay in the comments. I will give you a quick score and also some comments. Start today unless you need more ideas.
Home > IELTS > Writing > Academic Task 1
IELTS Academic Writing Task 1 Quiz: Too Difficult For You?


Academic IELTS Task 1 Essay Sample Answer
in England and Wales. Summarise the information by selecting and reporting the main features, and make
comparisons where relevant.
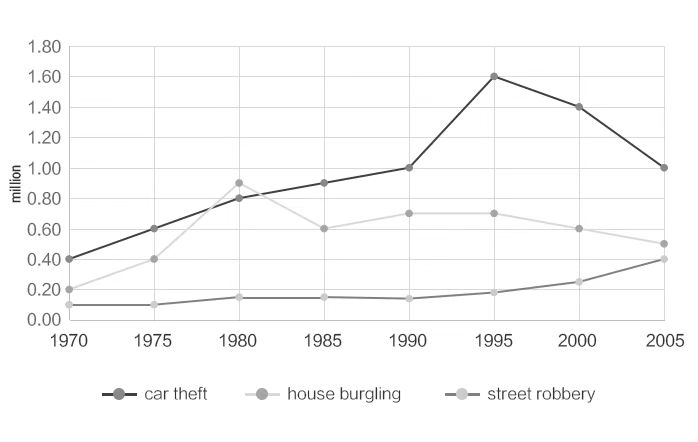
The line chart shows how many instances of car theft, house burgling and street robbery were committed from 1970 to 2005, in units of 200,000.
Overall, it is clear from the chart that apart from a brief spell, car theft was by far the most prevalent crime, and with burglary, showed a steady uptrend before falling back. Street robbery, on the other hand, had much fewer cases but increased towards the end of the 35 year period.
From 1970 to 1990, the theft of cars more than doubled from 0.4 million to 1 million, while over the same time frame burglaries rose steeply to around 0.9 million in 1980 before declining to 0.7 million. Muggings or robberies in the street remained relatively stable over this period.
After 1990, however, the number of car thefts rocketed to 1.6 million in 1995, returning to its original 1990 figure in 2005, whereas house burgling decreased steadily to about 0.5 million in the same year. Over the same 15 years, robbery committed in the street slowly curved upwards to 0.4 million, more than twice its 1990 figure.
Remember to post your essay in the comments at the bottom of this page so I can give you a score!
Less Common Vocabulary for this Essay
a brief spell – a short period of time
burglaries – breaking into houses and stealing things, regardless of if someone is in the house or not
prevalent – widespread in a particular area or at a particular time
time frame – a time period
muggings – street robberies, usually with violence
curved upwards – as in a bend higher, not a straight line
Even more vocabulary on education is available here.
Remember to post your essay in the comments at the bottom of this page so I can give you a score!
Related Content
IELTS Writing
The IELTS Writing test evaluates your ability to express ideas clearly, organize information logically, and use a range of vocabulary…
IELTS Writing Task 2 Information and Advice

IELTS Writing Task 2 is worth twice as many marks as Task 1, so it is essential that you are…
IELTS General Training Writing Task 1 Information and Advice

Tone is an essential ingredient of any IELTS General Training Writing Task 1 letter. Write for your reader, whether that’s…
IELTS Academic Writing Task 1 Information and Advice

IELTS Academic Writing Task 1 is either tricky or a nightmare, often the difference between a target writing score and…
IELTS Writing Task 2 Quiz: All Clear & Simple?

So you think you know everything there is to know about writing an IELTS Writing Task 2 essay? Check out…
IELTS Academic Writing Task 1 Quiz: Too Difficult For You?

This quiz includes general facts as well as questions asking which overview or paraphrase is best. IELTS Academic Writing Task…
IELTS Task 1 Writing Questions.

Here are IELTS Writing Task 1 questions for you to practice your writing skills. Another way to improve your score…
IELTS General Training Task 1 Sample Answers
This is a list of sample answers for IELTS General Training Task 1 writing questions, some of which has a…
IELTS Task 2 Essay Sample Answers

This is a list of sample answers for IELTS Task 2 essay questions, each of which has a list of…
IELTS Grammar Repair Kit: Fix Your GRA Now!

Introduction In IELTS writing, you are marked on four criteria: Task Response, Coherence and Cohesion, Lexical resource and Grammar Range…