
Paraphrasing for IELTS Academic Writing Task 1 can be tricky for many IELTS exam takers, especially in Task 1 for the academic writing test. There are different kinds of charts, graphs, tables, processes, cycles and maps to remember. This is an essential skill to practice so you can do it quickly and accurately in your test. Learn the process quickly and effectively and use the IELTS paraphrasing exercises below to build your confidence!
Home > IELTS > Writing > Academic Task 1
IELTS Academic Writing Task 1 Quiz: Too Difficult For You?


So, for paraphrasing for the academic Task 1 test, let’s begin by looking at the different ways the information can be illustrated.
Names of charts
line graph
bar chart
pie chart
table
cycle
process
map
Accuracy is essential when describing which kind of charts they are because, you need to assume that the reader cannot see the chart. Many think that Task 1 is about describing the chart when people can see it, but what would be the point of that. Task 1 measures a very useful skill for both study and employment at many levels.
Synonyms
Lets talk about using synonyms when paraphrasing. Using synonyms is difficult because they are often less accurate, unless you use one for a common word or two. For example in English, fish is not meat. Although wages and salaries are similar, they are not the same (one is monthly, the other daily or weekly). Also, planes are not public transport in most countries.
Synonyms are more appropriate when used with the common words in Task 1 chart descriptions.
Here are some of the more common ones.
Shows = depicts = reveals = illustrates = indicates
Between 2001 and 20010 = from 2001 to 2010 = from 2001 until 2010 = over a ten year period from 2001 to 2010
Shows information -> compares and contrast data on the
changes in the amount of … (un count)
changes in the number of …(count)
changes in … levels (population / pollution /….)
Sales = income = revenue = turnover = how much money was made.
The income rate = the income level = the level of income = the rate of income = the level of revenue = the revenue rate = the revenue level
New York City bookstore = bookstore in New York City
Proportion = percentage = rate
The proportion of= the percentage of= the figure for.
From 2000 to 2005 = between 2000 and 2005 = Over a period of (5) years.
The elderly = elderly people = senior citizens.
Spending = expenditure.
Information = data
Levels of unemployment = Unemployment rate.
Poverty rate = Level of poverty.
Production = manufacture = be produced = be made = be manufactured
Other ways
So what other ways are there to use your own words, or words that are different to those in the question? As you will see here, there are three other ways for Task 2, but only one further way can be used sparingly in Task 1.
1/ Changing form
The first is to keep the same word but change the form, usually verbs to nouns and nouns to verbs, or verb phrases and noun phrases, so:
Rate of unemployment = unemployment rate
What electricity is used for = electricity use
Birth rates = rates of birth
Journeys abroad = overseas journeys
Do regular physical activity = exercise regularly (But not sports, which is not a synonym of exercise)
From America = American
Consumption = how much was consumed
2/ Adding information
In Task 1, but not Task 2, it is possible to add information from the chart, map etc. Below are some examples.
Categories
Four countries = the UK, France, Australia and Italy
Fish and different kinds of meat = fish, beef, lamb and chicken.
Stages = six steps
Tip – Take care doing this, it can make your sentences too long.
What is being measured?
Revenue, exports, deaths, sales of gold ……
What are the units?
In billions of pounds, tons of wheat, percentages, deliveries …….
Tip – Personally, I don’t like this in the paraphrase, because you MUST do it in the body paragraphs.
Years
2001, 2002, 2003,……..
Time period
10 years, 30 years, six months, a week…..
From 2001 to 2009 / between 2001 and 2009 / over an 8 year period from 2001 to 2009 / from 2001 until 2009
Tip
A useful tip is to think of a table like this
| Type of chart | |
| What is being measured | |
| Units | |
| Categories | |
| Years | |
| Time period |
The quick way
Read the question and split it into parts
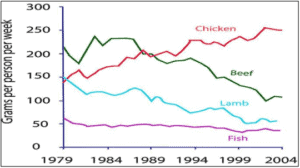
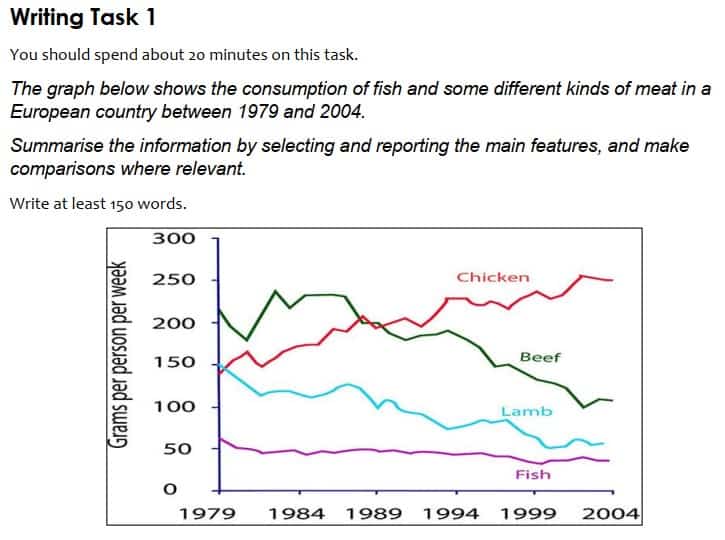
Question – The graph below shows the consumption of fish and some different kinds of meat in a European country between 1979 and 2004.
The graph = the line chart
shows = compares and contrasts the data on the changes in the amount of
the consumption of = consumed
fish and different kinds of meat = beef, lamb, fish and chicken
in a European country = in a country in Europe
between 1979 and 2004 = from 1979 to 2004
Paraphrase – The line graph compares and contrasts data on the changes in the amount of beef, lamb, chicken and fish consumed in a country in Europe from 1979 to 2004.
Here are some examples for charts that have a time period
Question – The graph below shows the consumption of fish and some different kinds of meat in a European country between 1979 and 2004.
Paraphrase – The line chart compares and contrasts data on the changes in the amount of beef, lamb, chicken and fish consumed in a country in Europe from 1979 to 2004.
Question -> Paraphrase
The graph -> The line chart (synonym)
shows -> compares and contrasts data on the changes (synonym)
-> in the amount of (added information – grams per week per person)
the consumption(n) -> consumed(v) (change of form)
fish and some different kinds of meat -> beef, lamb, chicken and fish (added information)
in a European country -> in a country in Europe (change of form)
between 1979 and 2004 -> from 1979 to 2004 (change of form)
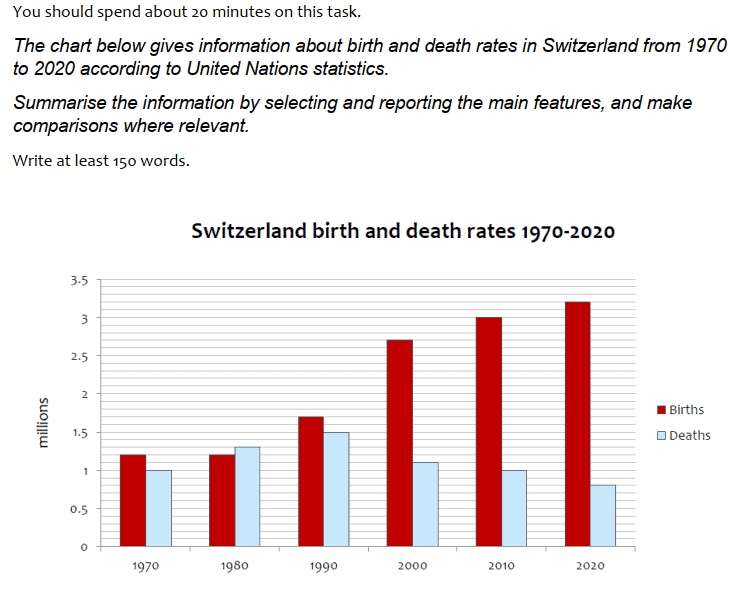
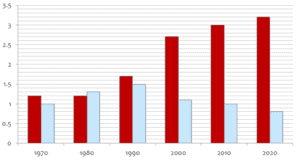
Question – The chart below gives information about birth and death rates in Switzerland from 1970 to 2020 according to United Nations statistics.
Paraphrase – The bar chart compares and contrasts data from the United Nations on the changes in the numbers of Swiss births and deaths between 1970 and 2020.
Question -> Paraphrase
The chart -> The bar chart (synonym)
gives information -> compares and contrasts xxxxxxxxxxxxxxx on the changes (synonym)
birth and death rates in Switzerland -> numbers of Swiss births and deaths (change of form)
from 1970 to 2020 -> between 1970 and 2020 (change of form)
United Nations statistics -> data from the United Nations data (change of form)
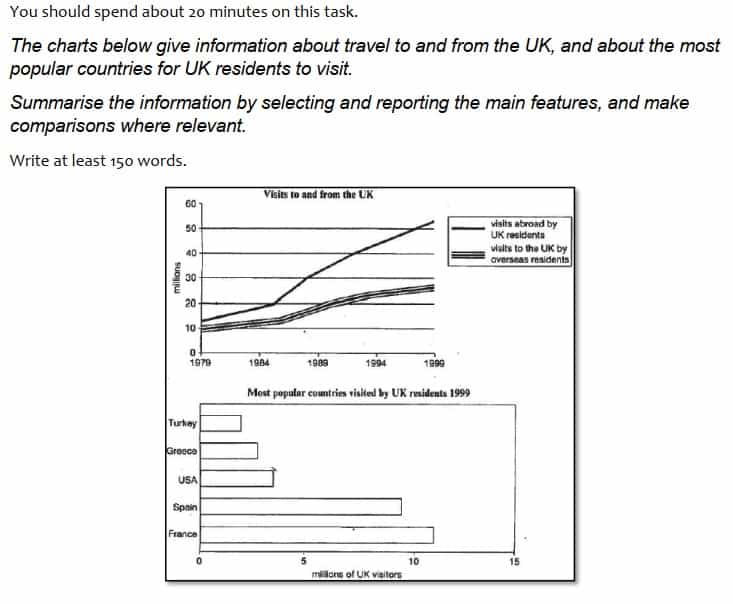
Question – The charts below give information about travel to and from the UK, and about the most popular countries for UK residents to visit.
Paraphrase – The line graph compares and contrasts the numbers of foreign visitors to the UK and foreign trips taken by British nationals between 1979 and 1990, while the bar chart depicts data on British people’s favourite travel destinations.
Question -> Paraphrase
The charts -> The line graph / the bar chart (synonyms)
give information -> compares and contrasts data on (synonym)
travel to and from the UK -> trips into and out of the UK (synonym)
-> five (added information)
the most popular -> favourite (synonym)
countries xxx to visit -> travel destinations (synonym)
UK residents -> British people (synonym)
-> between 1979 and 1990 (added information)
Charts with no time period
Tables
Everything is the same apart from:
Shows information = compares and contrast data on the differences between/in …. and ….
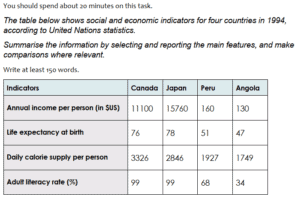
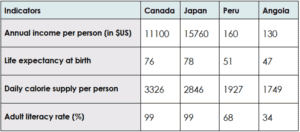
Question – The table below shows social and economic indicators for four countries in 1994, according to United Nations statistics.
Paraphrase – The table contrasts and compares the differences in United Nations data on both society and the economy in Canada, Japan, Peru and Angola during 1994.
Question -> Paraphrase
The table -> The table (no change)
shows -> contrasts and compares the differences between (synonym)
social and economic indicators -> data on society and the economy (change of form)
four countries -> Canada, Japan, Peru and Angola (added information)
in 1994 -> during 1994 (change of form)
according to United Nations statistics -> United Nations data (synonym)
Pie charts
Everything is the same apart from:
Shows information = compares and contrast data on the share of
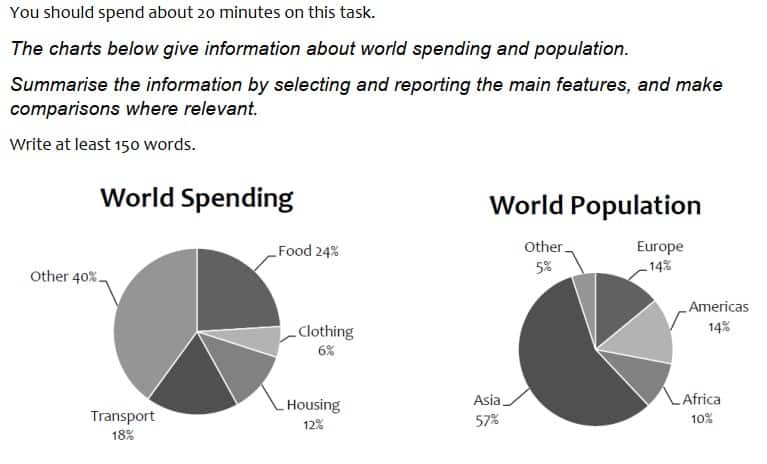
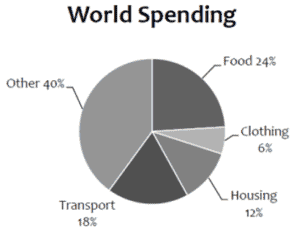
Question – The charts below give information about world spending and population.
Paraphrase – The two pie charts compare and contrast the share of four major items in global expenditure as well as how global population is distributed.
Question -> Paraphrase
The charts -> The two pie charts (added information)
Give information -> compare and contrast the share of (synonym)
-> four major items (added information)
World spending -> global expenditure (synonym)
population -> global population is distributed (added information)
Charts with no data
Not every chart shows data, some show a cycle or a process. These are not charts, but illustrations / diagrams / pictures.
Cycles
For the vast majority of these tasks, the question is about nature in some way. If you notice in the paraphrase below the bee cycle diagram, I have used ‘cyclical nature’. Here ‘nature’ has the same meaning as ‘aspect’ or ‘characteristic’ rather than anything to do with biology.
X’s life cycle = the cyclical nature of X’s life
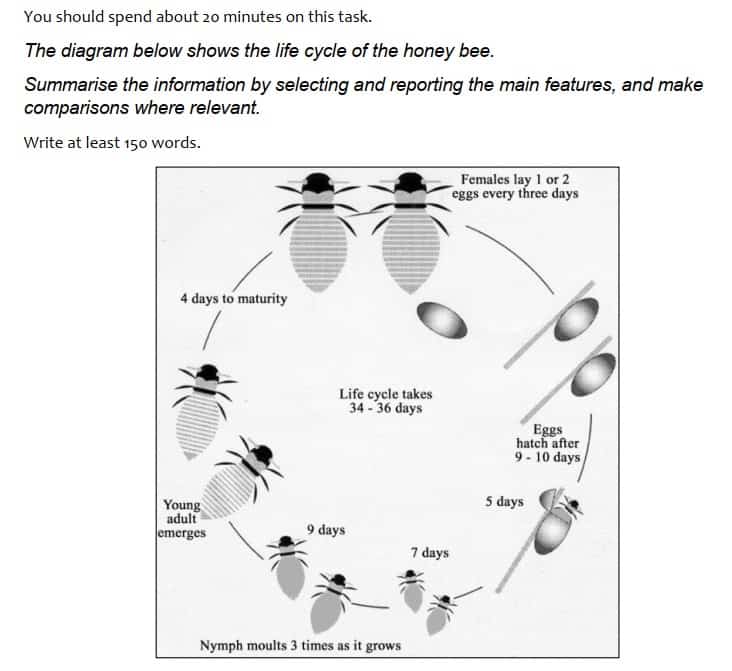
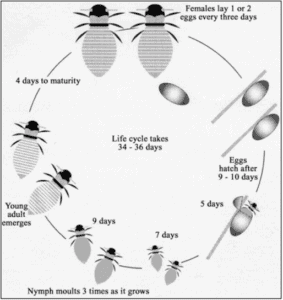
Question – The diagram shows the life cycle of the honey bee.
Paraphrase – The illustration depicts the cyclical nature of a honey bee’s life from egg to full maturity to egg.
Tip – I have added ‘from egg to full maturity to egg’ to show how I am going to talk about the cycle.
Question -> Paraphrase
The diagram -> The illustration (synonym)
shows -> depicts (synonym)
the life cycle of the honey bee -> the cyclical nature of a honey bee’s life (change of form)
-> from egg to full maturity to egg (added information)
Processes
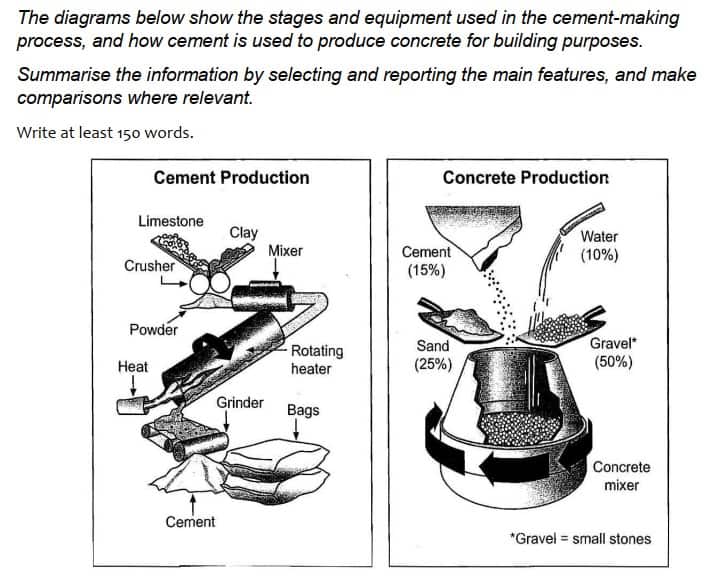
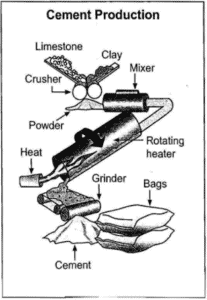
Question – The diagrams below show the stages and equipment used in the cement making process, and how cement is used to produce concrete for building purposes.
Paraphrase – The illustrations depict the six step procedure and the necessary machinery to make cement, as well as how cement is mixed with gravel, water and sand to make concrete used in construction.
Question -> Paraphrase
The diagrams -> The illustrations (synonym)
Show -> depict (synonym)
The stages -> the six step (synonym and added information)
Equipment used -> necessary machinery (synonym)
The cement making process -> procedure …….to make cement (synonym and change of form)
How cement is used -> how cement is mixed with gravel, water and sand (added information)
To produce -> to make (synonym)
For building purposes -> used in construction (synonym)
Maps
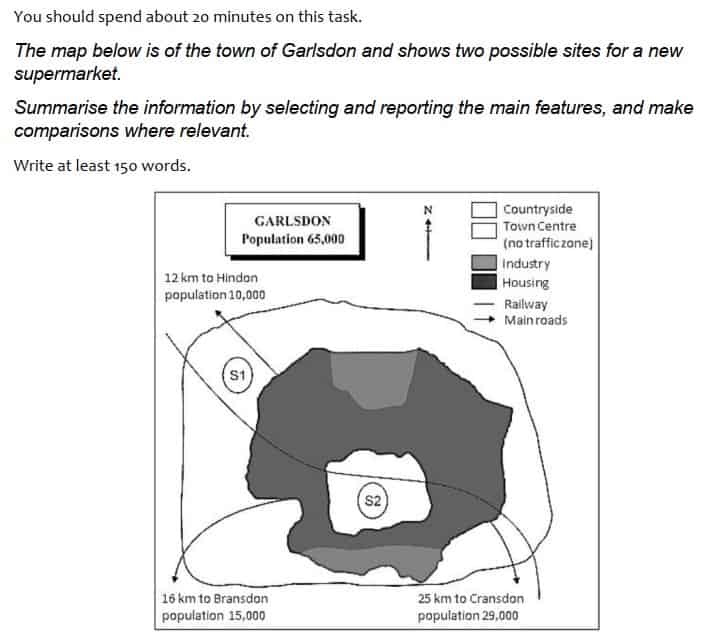
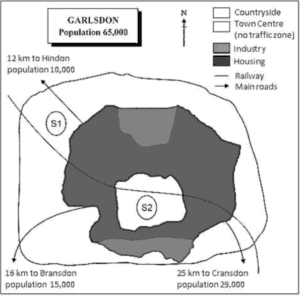
Question – The map below is of the town of Garlesdon and shows two possible sites for a new supermarket.
Paraphrase – The map illustrates two options in city centre and green belt locations for a proposed supermarket in Garlesdon, a town of 16,000 people.
Question -> Paraphrase
The map -> The map (no change)
Is of -> illustrates (synonym)
The town Garlesdon -> Garlesdon, a town of 16, 000 people (change of form and added information)
Two possible -> two options (synonym)
Sites -> locations (synonym)
New supermarket -> proposed new supermarket (added information)
Development maps
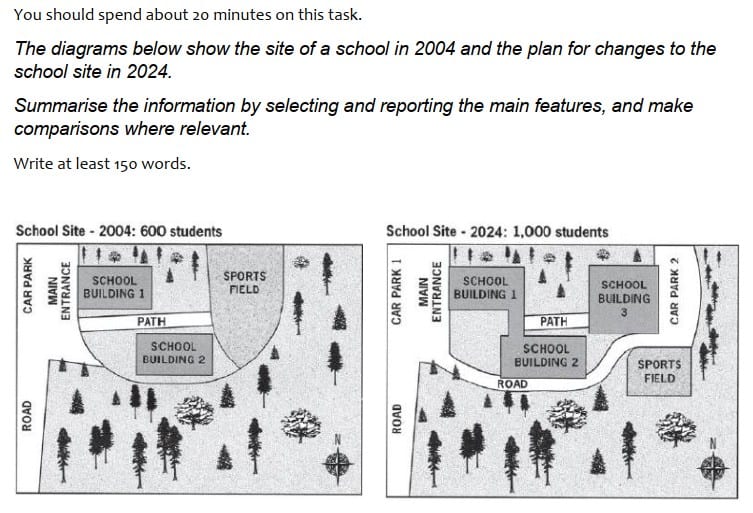
Question – The diagrams below show the site of a school in 2004 and the plan for changes to the school site in 2024.
Paraphrase – The illustrations compare and contrast the changes planned for a school’s infrastructure and number of pupils in 2024 with those in 2004.
Question -> Paraphrase
The diagrams -> The illustrations (no change)
Show -> compare and contrast the (synonym)
The site of a school -> a school’s infrastructure and grounds (synonym)
In 2004/ in 2024 -> in 2004/in 2024 (no change)
Plan for changes -> changes planned (change of form)
I hope these examples have helped you to understand the different ways that can be use when paraphrasing a Task 1 question and how they can be varied. As ever, practice will make this skill even better.